Setting up Docker Swarm
Prerequisites
Docker
Installation of VS on Docker Swarm requires only Docker Engine installed. It has been successfully tested with version 19 an 20.
Operating System
VS should be deployable on any reasonably new Unix based system and has been successfully tested to be deployed via Docker Swarm on following systems:
Red Hat Enterprise Linux 7.9
Red Hat Enterprise Linux 8.6
Ubuntu 18.04
Ubuntu 20.04
Python and helm
For configuration files generation, Python 3, Helm are essential but do not need to be installed on the target deployment system.
Initialization Swarm
In order to set up an instance of the View Server (VS) for Docker Swarm, the separate
vs_starter utility is recommended. Minimum Python version to be used is 3.8.
Its objective is to create a set of static docker
compose configuration files using the rendered helm templates,
which in turn use a set of previously created values.yaml files.
See Operating on Kubernetes for more information about values.yaml, how to create them and meaning of individual values.
First ensure that you have Helm software installed in order to generate the helm templates - instructions can be found on the install page.
The vs_starter utility is distributed as a Python package and easily
installed via pip.
pip3 install git+https://gitlab.eox.at/vs/vs-starter.git
Configuration files for a new VS Swarm collection named test and deployment staging
with additional set of PRISM specific configuration values can be created by:
# render helm templates from two sets of values.yaml files (generic ones and deployment specific).
helm template test-staging <chart-location> --output-dir ./rendered-template --values ./test/values.yaml --values ./test/values.staging.yaml

# convert the templates content to docker compose swarm deployment files
vs_starter rendered-template/vs/templates <OUTPUT_PATH> --slug test --environment staging -o $PWD/test/docker-compose.shared.yml -o $PWD/test/docker-compose.instance.yml
Following environments are supported: dev, staging, ops in the templates.
Name of the collection - --slug parameter should be containing only lowercase letters and underscores.
-o optional multiple parameters stand for absolute paths to additional override templates to be rendered together with the default one from vs-starter.
For more detailed usage guide for vs-starter, continue to vs-starter README and vs-starter sample templates.
Once the initialization is finished the next step is to deploy the Docker Swarm stack.
Setup Docker Swarm
In this chapter the setup of a new VS stack is detailed. Before this step can be done, the configuration and environment files need to be present. These files can be added manually or be created as described in the Initialization Swarm step.
Docker
In order to deploy the Docker Swarm stack to the target machine, Docker and its facilities need to be installed.
This step depends on the systems architecture. On a Debian based system this may look like this:
sudo apt-get install \
    apt-transport-https \
    ca-certificates \
    curl \
    gnupg-agent \
    software-properties-common

curl -fsSL https://download.docker.com/linux/debian/gpg | sudo apt-key add -

# add the apt repository
sudo add-apt-repository \
    "deb [arch=amd64] https://download.docker.com/linux/debian \
    $(lsb_release -cs) \
    stable"

# fetch the package index and install Docker
sudo apt-get update
sudo apt-get install docker-ce docker-ce-cli containerd.io
Docker Swarm setup
Now that Docker is installed, the machine can either create a new swarm or join an existing one.
To create a new Swarm, the following command is used:
docker swarm init --advertise-address <ip>
where ip will be the IP of master node, under which it will be reachable by the worker nodes. If only a single node setup (dev) is created, then –advertise-address is not needed.
Alternatively, an existing Swarm can be joined by a worker. The easiest way to do this, is
to obtain a join-token. On an existing Swarm manager (where a Swarm was
initialized or already joined as manager) run this command:
docker swarm join-token worker
This prints out a command that can be run on a machine to join the swarm:
docker swarm join --token <obtained token>
It is possible to dedicate certain workers for example to contribute to ingestion exclusively, while others can take care only for rendering. This setup has benefits, when a mixed setup of nodes with different parameters is available.
In order to set a node for example as external, to contribute in rendering only, one can simply run:
docker node update --label-add type=external <node-id>
Additionally, it is necessary to modify placement parameter in the docker compose file. Note that default vs-starter templates do not consider any external/internal label placement restrictions.
renderer:
  deploy:
    placement:
      constraints:
        - node.labels.type == external
Additional information for swarm management can be obtained in the official documentation of the project.
Optional Logging setup
For staging and ops environments, the services in the sample compose files reference the fluentd logging
driver, no manual change is necessary.
Another possible way is to configure the default logging driver on the docker daemon level to
be fluent by creating the file /etc/docker/daemon.json with the following content:
{
    "log-driver": "fluentd"
}
and afterwards restarting the docker daemon via
systemctl restart docker
For dev environment, compose files for configure the json logging driver for each
service.
Configuration
VS services configuration before deployment is done in two places. First are the values.yaml and the second can optionally be the docker-compose templates used by vs-starter.
Applying changes
After the operator makes any changes to any of the values.yaml, then for them to be applied, the combination of
helm template and vs-starter commands needs to be performed.
If changes only in docker-compose templates are done, then running just vs-starter is enough.
It is expected that any necessary changes to the service configurations by the operator are done on the level of docker-compose templates, rather than on the level of rendered docker-compose configuration yamls to allow re-running the vs-starter and helm template commands in the future for the same collection (for example to apply image version upgrades).
The following command then automatically restarts all services of a stack with changed configuration files. This is done by re-using the stack rm and stack deploy commands - see stack redeployment.
Types of per-stack defined docker-compose files
The previous command expects the usage of three sets of docker-compose files per stack. They are documented in more detail in the following description which should serve as a suggestion of possible deployment, not a must.
docker-compose.yml
It is included by default in vs-starter and will always be rendered - Current version of the template. The operator does not have a way to change this file in another way than a Merge request to the original repository. It is not expected changes to this template will be necessary as overrides are possible by other docker-compose files.
docker-compose.instance.yml
Collection-specific overrides file, which holds special rules for one single stack, therefore hosting configuration which differs between individual collections. Sample docker-compose.instance.yml. It is expected that it will be created once for every collection that needs specific compose overrides.
For more information to sample compose templates refer to vs-starter sample templates README.
Docker Compose Settings
This section describes general docker-compose concepts used in VS vs-starter templates.
These configurations are altering the behavior of the stack itself and its contained services. A complete reference of the configuration file structure can be found in the Docker Compose documentation.
Environment Variables
All necessary files are created from templates when vs_starter
the tool is used on rendered helm templates.
These variables are passed to their respective container’s environment and
change the behavior of certain functionality. They can be declared in the
docker-compose configuration file directly, but typically they are bundled by
field of interest and then placed into .env files and then passed to the
containers. So for example, there can be a db.env file
to store database access details. This file will be already prefilled from the template rendering step.
All those files are placed in the config/ directory in the instances
directory.
Environment variables and .env files are passed to the services via the
docker-compose.yml directives. The following example shows how to pass
.env files and direct environment variables:
services:
  # ....
  registrar:
    env_file:
      - ./config/db.env
      - ./config/django.env
    environment:
      INSTANCE_ID: "view-server_registrar"
      # ...
    # ...
.env Files
The following .env files are typically used:
db.env: The database access credentials, for all services interacting with the database.django.env: This env file defines the credentials for the Django admin user to be used with the admin GUI.
Groups of Environment Variables
GDAL Environment Variables
This group of environment variables controls the intricacies of GDAL. They control how GDAL interacts with its supported files. As GDAL supports a variety of formats and backend access, most of the full list of env variables are not applicable and only a handful are relevant for the VS.
GDAL_DISABLE_READDIR_ON_OPEN- Especially when using an Object Storage backend with a very large number of files, it is vital to activate this setting (=TRUE) to suppress to read the whole directory contents which is very slow for some OBS backends.CPL_VSIL_CURL_ALLOWED_EXTENSIONS- This limits the file extensions to disable the lookup of so-called sidecar files which are not used for VS. By default this is unset, as it may cause unintended behavior with Zarr files. It is recommended to set this to a comma-separated string of file suffixes of expected file formats to be included in the VS instance (.TIF,.tif,.xml`)GDAL_PAM_ENABLED- Set to NO to prevent unintended writing to persistent auxiliary metadata.GDAL_HTTP_TIMEOUT- Set in preprocessor to 30GDAL_HTTP_MAX_RETRY- Set in preprocessor to 16GDAL_HTTP_RETRY_DELAY- Set in preprocessor to 5CPL_VSIL_GZIP_WRITE_PROPERTIES- Set in preprocessor to NO. This is done to ensure no writing happens to recursive GZIP archives
Django Environment Variables
These environment variables are used by the VS itself to configure various parts.
Note
These variables are used during the initial stack setup. When these variables are changed, they will not be reflected unless the instance volume is re-created.
DJANGO_USER,DJANGO_MAIL,DJANGO_PASSWORDsecret - The Django admin user account credentials to use the Admin GUI.
Other Environment Variables
DEBUG- when set totrue, on most services turns on debug (verbose) logging
Renderer environment variables
ENABLE_HTTP_ACCESS- when set totrueenables HTTP proxy interface of the renderer for direct data HTTP access by requests with range headers
Configuration Files
Such files are passed to the containers in a similar way as the environment variables, but usually contain more settings at once and are placed at a specific path in the container at runtime.
Configuration files are passed into the containers using the configs
section of the docker-compose.yaml file. The following example shows how
such a configuration file is defined and used in service although direct editing of
generated files from vs-starter is not expected. Update the configurations always through the
values before the helm template step if possible. The following contents are left as
a backward-compatible reference.
# ...
configs:
  my-config:
    file: ./config/example.cfg
# ...
services:
  myservice:
    # ...
    configs:
    - source: my-config
      target: /example.cfg
The following configuration files are used throughout the VS:
init-db.sh
This shell script file’s purpose is to set up the EOxServer instance used by both the renderer and registrar.
Some browsetype functions with pre-set variables that can be used for elevation rasters are:
hillshade(band, var('zfactor', 5), 111120, var('azimuth', 315), var('altitude', 45), var('alg', 'Horn'))
range 0 - 255
nodata 0
aspect(band, False, False, var('alg', 'Horn'))
range 0 - 360
nodata -9999
slopeshade(gray, 111120)
range 0 - 255
nodata -9999
contours(gray, var('offset', 0), var('interval', 30))
range 0 - 360
nodata - 9999
roughness(gray)
range 0 - 20
nodata - 9999
tri(gray)
range 0 - 8
nodata - 9999
Example:
python3 manage.py browsetype create "DEM_Product_COP-DEM_GLO-30-DTED"  "aspect" \
    --grey "aspect(gray, False, False, var('alg', 'Horn'))" \
    --grey-range 0 360 \
    --grey-nodata -9999

python3 manage.py browsetype create "DEM_Product_COP-DEM_GLO-30-DTED"  "contours" \
    --grey "contours(gray, var('offset', 0), var('interval', 30))" \
    --grey-range 0 360 \
    --grey-nodata -9999

python3 manage.py browsetype create "DEM_Product_COP-DEM_GLO-30-DTED"  "hillshade" \
    --grey "hillshade(gray, var('zfactor', 5), 111120, var('azimuth', 315), var('altitude', 45), var('alg', 'Horn'))" \
    --grey-range 0 255 \
    --grey-nodata 0

python3 manage.py browsetype create "DEM_Product_COP-DEM_GLO-30-DTED"  "roughness" \
    --grey "roughness(gray)" \
    --grey-range 0 20 \
    --grey-nodata -9999

python3 manage.py browsetype create "DEM_Product_COP-DEM_GLO-30-DTED"  "slope" \
    --grey "slopeshade(gray, 111120)" \
    --grey-range 0 50 \
    --grey-nodata -9999

python3 manage.py browsetype create "DEM_Product_COP-DEM_GLO-30-DTED"  "tri" \
    --grey "tri(gray)" \
    --grey-range 0 8 \
    --grey-nodata -9999
To use the pansharpening function the True Color browse type would look like this:
pansharpen(pan, red, green, blue, nir)[0]
range 0 - 2000
nodata 0
Example:
python3 manage.py browsetype create "NAO_BUN_1A"  "TRUE_COLOR_PANSHARPENED" \
    --red "pansharpen(pan, red, green, blue, nir)[0]" \
    --green "pansharpen(pan, red, green, blue, nir)[1]" \
    --blue "pansharpen(pan, red, green, blue, nir)[2]" \
    --red-range 1 1000 \
    --green-range 1 1000 \
    --blue-range 1 1000 \
    --red-nodata 0 \
    --green-nodata 0 \
    --blue-nodata 0 \
    --traceback
Sensitive variables
Since environment variables include credentials that are considered sensitive,
avoiding their exposure inside .env files would be the right practice.
To manage to transmit sensitive data securely into the respective containers,
docker secrets with the values of these variables should be created.
Currently, basic configuration templates reference two variables that have to be saved as
docker secrets before deploying the swarm: DJANGO_PASSWORD and DJANGO_SECRET_KEY.
An example of creating DJANGO_PASSWORD as secret on the manager node using the following command :
printf "<password_value>" | docker secret create DJANGO_PASSWORD -
PRISM specific secrets
The following docker secret for traefik basic authentication needs to be created:
BASIC_AUTH_USERS_APIAUTH - used for admin access to kibana and traefik.
Access to the services for alternative clients not supporting main Shibboleth authentication entry points is configured by creating a local file BASIC_AUTH_USERS inside the cloned repository folder.
The secret and the pass file should both be text files containing a list of username:hashed-password (MD5, SHA1, BCrypt) pairs.
Additionally, the configuration of the sftp image contains sensitive information, and therefore, is created using docker configs.
An example of creating configurations for an sftp image using the following command :
printf "<user>:<password>:<UID>:<GID>" | docker config create sftp-users-<name> -
An example of creating BASIC_AUTH_USERS_APIAUTH secret:
htpasswd -nb user1 3vYxfRqUx4H2ar3fsEOR95M30eNJne >> auth_list.txt
htpasswd -nb user2 YyuN9bYRvBUUU6COx7itWw5qyyARus >> auth_list.txt
docker secret create BASIC_AUTH_USERS_APIAUTH auth_list.txt
For configuration of the shibauth service, please consult a separate chapter Access in Docker Swarm.
Stack Deployment
Before the stack deployment step, some environment variables and configurations which
are considered sensitive (SECRETS) should be created beforehand, refer to Sensitive variables section.
Now that a Docker Swarm is established and docker secrets and configs are created, it is time to deploy the VS as a stack. This is done using the created Docker Compose configuration files.
The deployment of created stack compose files should be performed in following order:
base stack - with updated extnet networks for each <slug> collection
logging stack (references logging-extnet network from base)
-x) individual {slug} collections (references extnet network managed by base stack)
logging and base stacks
docker stack deploy -c docker-compose.base.yml base
docker stack deploy -c docker-compose.logging.yml logging
stack redeployment
For a redeployment of a single stack one would do following:
# only if was previously running
docker stack rm <stack-name>
collection_env="test-staging" && docker stack deploy -c "$collection_env"/docker-compose.yml -c "$collection_env"/docker-compose.shared.yml -c "$collection_env"/docker-compose.instance.yml <stack-name>
(replace test-staging with the actual slug-env identifier and assuming that the vs-starter did output the templates to “$collection_env”)
These commands performs a set of tasks. First off, it obtains all necessary docker images.
When all relevant images are pulled from their respective repository the services of the stack are initialized. When starting for the first time, the startup procedure takes some time, as everything needs to be initialized. This includes the creation of the database, user, required tables, and the Django instance.
That process can be supervised using the docker service ls command, which
lists all available services and their respective status.
If a service is not starting or is stuck in 0/x state, inspect its logs or status via
docker service ps --no-trunc <service_name>
docker service logs <service_name>
The above mentioned process necessarily involves a certain service downtime between possible shutting down of the stack and new deployment.
Service Management
This section shows how a deployed VS stack can be interacted with.
Scaling
Scaling is a handy tool to ensure stable performance, even when dealing with higher usage on any service. For example, the preprocessor and registrar can be scaled to a higher replica count to enable a better throughput when ingesting data into the VS.
The following manual command scales the renderer service to 5 replicas:
docker service scale <stack-name>_renderer=5
A service can also be scaled to zero replicas, effectively disabling the service.
Warning
The redis and database should never be scaled (their replica count
should remain 1) as this can lead to service disruptions and corrupted data.
Another way how to preset number of replicas is already on the level of values.yaml via
values.service_name.replicaCount key.
Updating Services or configuration files
Updating the VS software is done using previously established tools - helm template and vs-starter - see Initialization Swarm.
Image version is located in docker-compose templates and is prefilled automatically during helm template configuration step. The version values will come from the latest version of the vs-deployment charts, so to get the latest version simply git pull the latest vs-deployment chart.
If the operator wishes to keep a VS on a lower version than the current latest, it is possible to use a certain fixed version of the vs-deployment chart rather than the latest.
Each stack that needs to be updated needs to be torn down and redeployed - see stack redeployment.
Running commands in VS services
For administration, it can be necessary to run commands directly in one of the services.
This subchapter documents docker swarm-specific management steps.
To exectute a command in a redis container with in a given stack, use:
docker exec -it $(docker ps -qf "name=^<stack-name>_redis") <command>
For platform agnostic management and operations steps, visit chapter Operations and management.
Inspecting logs in development
All service components are running inside docker containers and it is, therefore, possible to inspect the logs for anomalies via standard docker logs calls redirected for example to fewer commands to allow paging through them.
docker logs <container-name> 2>&1 | less
In case only one instance of a service is running on one node, the <container-name> can be returned by fetching the available containers of service on that node with a command
docker logs $(docker ps -qf "name=<stack-name>_<service-name>") 2>&1 | less
It is possible to show logs of all containers belonging to a service from a master node, utilizing docker service logs command, but the resulting listing does not enforce sorting by time. Although logs of each task appear in the order they were inserted, logs of all tasks are outputted interleaved. To quickly check the latest time-sorted logs from the service, sorting the entries by timestamp column, do:
docker service logs <stack-name>_<service-name> -t 2>&1 | sort -k 1 2>&1 | tail -n <number-of-last-lines> 2>&1 | less
The docker service logs are intended as a quick way to view the latest log entries of all tasks of service, but should not be used as a main way to collect these logs. For that, on production setup, an additional EFK (Elasticsearch, Fluentd, Kibana) stack is deployed.
Inspecting logs from the logging stack
Fluentd is configured as the main logging driver for production VS deployment. To access the logs, an interactive and multi-purpose Kibana interface is available and exposed externally by traefik.
Kibana is usually available under a hostname defined by the operator in logging compose file - the default value is kibana.<service-url>.
For a simple listing of the filtered time-sorted logs as an equivalent to the docker service logs command, a basic Discover app can be used. The main panel to interact with the logs is the Search bar, allowing filtered field data and free-text searches, modifying time ranges, etc. The individual log results will then appear in the Document table panel at the bottom of the page.
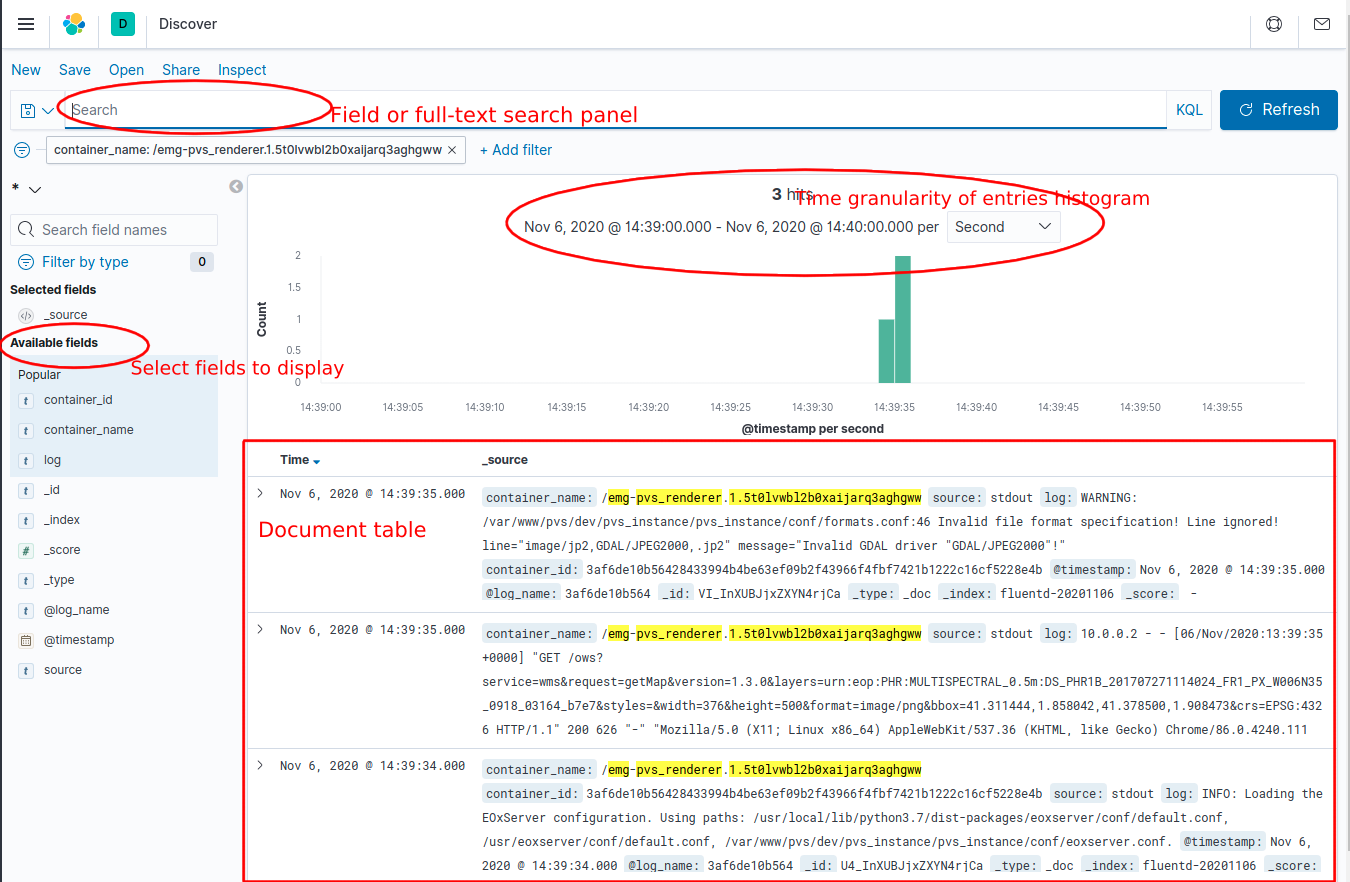
Figure 2 Kibana discover panel
For specific help with Discover panel, please consult Kibana official documentation
To select any other option from the Kibana toolkit, click the horizontal lines selection on the top left and pick a tool.
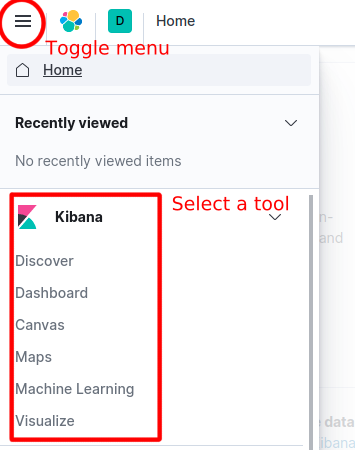
Figure 3 Kibana menu
Kibana also allows aggregating log data based on a search query in two modes of operation: Bucketing and Metrics being applied on all buckets.
These aggregations are used in Visualisations with various chart modes like a vertical bar chart, and a horizontal line chart. Using saved searches improves the performance of the charts due to limiting the results list.
Kibana useful queries
Successfully registered or replaced products during registration
fulltext search: "stack_registrar" and ("Successfully registered Product" or "Successfully replaced Product")
Failed registrations
add custom filter exception: exists and use fulltext search for: "stack_registrar" and not "fluent"
WMTS + WMS requests for a stack
fulltext search: "stack" and ("renderer" or "cache") and "ows"
Increasing logging level
In the default state, all components are configured to behave in a production logging setup, where the amount of information contained in the logs is reduced.
All View Server services (except Redis and database) support setting a DEBUG=True environment variable increasing servicev verbosity by a rolling update of containers environment in the following way:
docker service update --env-add DEBUG=true <stack-name>_<service-name>
To put the services back to default production logging state, run:
docker service update --env-add DEBUG=false <stack-name>_<service-name>
If Operator is inspecting a concrete issue or failure status codes, then setting DEBUG mode of renderer or cache might be necessary.
If map tiles are not visible, consult network tab and get the failing requests.
Errors of cache service are usually reported for 4xx/5xx status code requests in the X-Mapcache-Error response header as a value. Increasing DEBUG logging is usually not needed.
Renderer service does usually not give any indication of the reason of failures unless DEBUG logging is enabled. On DEBUG ows:ExceptionReport XML with last error from the application is returned to the user as a response to the problematic operation or malformed request.
Preprocessor, registrar and harvester can give our more information on setting DEBUG logging.
Database backup
The database can be backed up with the script below. The STACK and BACKUP_PATH variables can be changed depending on the stack and desired path of backup files
#!/bin/bash

# Variables to be changed
STACK="dem"
BACKUP_PATH="/path/to/backup/storage"

# Script variables
FILE_NAME="$(date +'%Y%m%d').sql.gz"
DB_SERVICE=""$STACK"_database"
DB_CONTAINER="$(docker ps -l -q -f name=^/$DB_SERVICE)"

echo "Backing up $STACK stack"
echo "Backup path: $BACKUP_PATH"
echo "Backup file: $FILE_NAME"
echo "Backup service: $DB_SERVICE"
echo "DB container id: $DB_CONTAINER"

echo "Backing up to /$FILE_NAME"
docker exec $DB_CONTAINER sh -c "pg_dump -U "$STACK"_user -d "$STACK"_db -f c > /$FILE_NAME"
echo "Copying to $BACKUP_PATH"
docker cp $DB_CONTAINER:/$FILE_NAME $BACKUP_PATH
echo "Cleaning up"
docker exec $DB_CONTAINER sh -c "rm /$FILE_NAME"
To restore from a backed-up file run the below script. Here the STACK, DATE, and BACKUP_PATH can be changed. Note: The date for the last backup must be in YYYYMMDD format
#!/bin/bash

# Variables to be changed
STACK="dem"
DATE="20210722"
BACKUP_PATH="/path/to/backups"

# Script variables
BACKUP_FILE="$BACKUP_PATH/$DATE.sql.gz"
UNCOMPRESSED_FILE="$BACKUP_PATH/$DATE.sql"
DB_SERVICE=""$STACK"_database"
DB_CONTAINER="$(docker ps -q -f name=$DB_SERVICE)"

echo "Restoring $STACK stack"
echo "Backup file: $BACKUP_FILE"
echo "Backup service: $DB_SERVICE"
echo "DB container id: $DB_CONTAINER"

echo "Unpacking $BACKUP_FILE"
gunzip $BACKUP_FILE
echo "Copying unpacked file"
docker cp $UNCOMPRESSED_FILE $DB_CONTAINER:/
echo "Restoring database"
docker exec $DB_CONTAINER sh -c "psql -U "$STACK"_user -d "$STACK"_db < /$DATE.sql"
echo "Cleaning up"
docker exec $DB_CONTAINER sh -c "rm /$DATE.sql"
rm $UNCOMPRESSED_FILE
The final section Data Ingestion explains how to get data into the VS.
Purging VS from machine
To completely remove VS and all its data from a node, where it was running before, you should do the following steps:
manually tear down all running VS stacks - logging, base and all individual collections via
docker stack rm <stack-name>manually remove all persistent docker volumes via
docker volume rm <volume-name>. If you are not sure which ones were created by VS, check all the individual docker-compose files used for deploying the stacks and find the keyvolumes.manually remove all docker images which contribute to VS by
docker image rm <image-name>.
If you are not sure which images or volumes contributed to VS, check all the individual docker-compose files used for deploying the stacks and find the key volumes or service.image.
Inspecting reports - PRISM specific
Once a product is registered, an XML report containing WCS and WMS GetCapabilities of the registered product is generated and can be accessed by connecting to the SFTP service via the sftp protocol.
To log into the folders through port 2222 for vhr18 or other respective ports on the hosting IP (e.g. localhost if you are running the dev stack) The following command can be used:
sftp -P 2222 <username>@<host>
this will direct the user into /home/<username>/data sftp mounted directory which contains the 2 logging directories : to/panda and from/fepd
Note
The mounted directory that the user is directed into is `/home/user`, where user is the username, hence when changing the username in the .conf file, the sftp mounted volumes path in docker-compose.<collection>.yml must be changed respectively.
Access in Docker Swarm
This chapter describes general concepts of how external access to each component is provided and how the authentication and authorization layer based on Shibboleth SP3 is configured in PRISM.
General overview
Each docker stack has its own internal network intnet where services can communicate with each other. This network is not exposed to the public and provides most of the necessary communication. Additionally, external user access to some services (client, renderer, cache, DEM: terrain-server, dem-app) is provided via external network extnet and reverse-proxy (traefik) with a load balancer.
These services can have a set of authentication and authorization rules applied both on the traefik level and Shibboleth SP level.
Routing with traefik
Reverse-proxy service in the base stack provides a central access endpoint to the VS. It exposes ports 80 and 443 for HTTP and HTTPS access in the host mode. Configuration of the reverse-proxy is done in three places.
The first two are static and dynamic configuration files traefik.yml and traefik-dynamic.yml. Static configuration sets up connections to providers and defines the entrypoints that Traefik will listen to. The dynamic configuration defines how the requests are handled. This configuration can change and is seamlessly hot-reloaded, without any request interruption or connection loss. The third part is a set of docker labels on individual services that Traefik provides access to, for which an update requires removing and re-creating the stack.
For example, the following configuration snippet enables access to certain paths of the renderer service under a given hostname. It also sets externally set basic authentication and other rules via @file identifier, which references global configurations from traefik-dynamic.yml.
renderer:
  deploy:
    labels:
      # router for basic auth-based access (https)
      - "traefik.http.routers.vhr18-renderer.rule=Host(`vhr18.pdas.prism.eox.at`) && PathPrefix(`/ows`, `/opensearch`, `/admin`)"
      - "traefik.http.routers.vhr18-renderer.middlewares=auth@file,compress@file,cors@file"
      - "traefik.http.routers.vhr18-renderer.tls=true"
      - "traefik.http.routers.vhr18-renderer.tls.certresolver=default"
      - "traefik.http.routers.vhr18-renderer.entrypoints=https"
      # general rules
      - "traefik.http.services.vhr18-renderer.loadbalancer.sticky=false"
      - "traefik.http.services.vhr18-renderer.loadbalancer.server.port=80"
      - "traefik.docker.network=vhr18-extnet"
      - "traefik.docker.lbswarm=true"
      - "traefik.enable=true"
An example of such auth@file configuration from traefik-dynamic.yml would be following snippet, where BASIC_AUTH_USERS_AUTH is referencing a docker secret configured earlier:
http:
  middlewares:
    auth:
      basicAuth:
        realm: "PRISM View Server (PVS)"
        usersFile: "/run/secrets/BASIC_AUTH_USERS_AUTH"
Updating of usersFile content needs a restart of reverse-proxy service afterward. Unsecured HTTP access is configured to be redirected to the HTTPS endpoint. Inside the swarm among the services, only HTTP is used internally.
Configuration
For the correct configuration of Shibboleth SP3 on a new stack, several steps need to be done. Most of these configurations are usually done in the Initialization Swarm step using vs_starter tool. Still, it is advised to check the following steps, understand them and change them if necessary.
Briefly summarized, SP and IdP need to exchange metadata and certificates to trust each other, SP needs to know which attributes the IdP will be sending about the logged-in user, and respective access-control rules are configured based on those attributes. Most of the configurations are done via docker configs defined in the docker-compose files.
Create a pair of key, certificates using the attached Shibboleth utility
config/shibboleth/keygen.shin the clonedvsrepository and save them as respective docker secrets.
SP_URL="https://emg.pass.copernicus.eu" # service initial access point made accessible by traefik
./config/shibboleth/keygen.sh -h $SPURL -y 20 -e https://$SP_URL/shibboleth -n sp-signing -f
docker secret create <stack-name>_SHIB_CERT sp-signing-cert.pem
docker secret create <stack-name>_SHIB_KEY sp-signing-key.pem
Get IDP metadata and save it as a docker config. Also, save the entityID of the IdP for further use in filling the
shibboleth2.xmltemplate.
docker config create idp-metadata idp-metadata-received.xml
Configure Apache ServerName used inside the
shibauthservice by modifyingAPACHE_SERVERNAMEenvironment variable of correspondingshibauthservice indocker-compose.<stack>.ops.yml. This URL should resolve to the actual service URL.Configure SP and IdP EntityIDs used inside the
shibauthservice by modifyingSPEntityIDandIDPEntityIDenvironment variables of correspondingshibauthservice indocker-compose.<stack>.ops.yml.SPEntityIDcan be chosen in any way, IDPEntityID should be extracted from received IDP metadata.Deploy your
shibauthservice and exchange your SP metadata with the IdP provider and have them register your SP. Necessary metadata can be downloaded from URL<service-url>/Shibboleth.sso/Metadata.Get information about attributes provided by IdP and update
config/shibboleth/attribute-map.xmlby adding individual entries mappingnameprovided by IdP toidused by SP internally. Example configuration:
<Attributes xmlns="urn:mace:shibboleth:2.0:attribute-map" xmlns:xsi="http://www.w3.org/2001/XMLSchema-instance">
  <Attribute name="urn:mace:dir:attribute-def:signed-terms" id="signed_terms_and_conditions"/>
  <Attribute name="urn:mace:dir:attribute-def:primary-group" id="user_group_primary"/>
</Attributes>
Create custom access rules based on these attributes and map these access controls to different internal Apache routes to which Traefik ForwardAuth middleware will point. Access rules are created in
config/shibboleth/<stack-name>-ac.xmlandconfig/shibboleth/<stack-name>-ac-cache.xml.
Example of external Access control rules configuration:
<AccessControl type="edu.internet2.middleware.shibboleth.sp.provider.XMLAccessControl">
  <AND>
    <RuleRegex require="signed_terms_and_conditions">.+</RuleRegex>
    <Rule require="user_group_primary">
     Privileged_Access Public_Access
    </Rule>
  </AND>
</AccessControl>
Check configured link between Apache configuration for the
shibauthservice, access rules, Traefik ForwardAuth middleware, and per-service Traefik labels. The following simplified examples show the links in more detail:
APACHE_SERVERNAME environment variable needs to be set and the same as the hostname, that Traefik will be serving as a main entry point. Part of docker-compose of shibauth service in docker-compose.emg.ops.yml:
services:
  shibauth:
    environment:
      APACHE_SERVERNAME: "https://emg.pass.copernicus.eu:443"
    deploy:
      labels:
        - "traefik.http.routers.shibauth.rule=Host(`emg.pass.copernicus.eu`) && PathPrefix(`/Shibboleth.sso`)"
        ...
Relevant Apache configuration in config/shibboleth/shib-apache.conf, enabling Shibboleth authentication and authorization of the renderer service on the /secure endpoint.
# Internally redirected to here. Rewrite for proper relaystate in shib
<Location /secure>
  RewriteEngine On
  RewriteCond %{HTTP:X-Forwarded-Uri} ^(.*)$ [NC]
  RewriteRule ^.*$ %1 [PT]
</Location>
<LocationMatch "^/(admin|ows|opensearch)">
  RewriteEngine On
  AuthType shibboleth
  ShibRequestSetting requireSession 1
  Require shib-plugin /etc/shibboleth/pass-ac.xml
  RewriteRule ^.*$ - [R=200]
</LocationMatch>
Part of Traefik ForwardAuth middleware configuration from docker-compose.emg.ops.yml, defining the internal address pointing to the shibauth-emg service and /secure endpoint in it:
renderer:
  deploy:
    labels:
      - "traefik.http.middlewares.emg-renderer-shib-fa.forwardauth.address=http://shibauth-emg/secure"
      - "traefik.http.routers.emg-renderer-shib.middlewares=emg-renderer-shib-fa,compress@file,cors@file"